Hi All,
My next couple of blogs will be a series of blogs where I will be explaining on how to use PowerShell for the monitoring of critical infrastructure. I will be releasing a blog every day that will touch on how to monitor specific software components, but also network devices from Ubiquity, third-party API’s and Office365. I will also be showing how you can integrate this monitoring in current RMM packages such as Solarwinds N-Central, Solarwinds RMM MSP and even include the required files to import the monitoring set directly into your system.
Requirements:
- Dell OpenManage Managed Node installation
- PowerShell v2 or higher
Creating the monitoring sets:
This is the second monitoring script is and still pretty straight forward. Instead of using the data retrieved from StorCli we’re going to use the OMReport functionality, which is a part of the Dell OpenManage Managed Node suite to extract the data to a usable array. OMReport has some cavets that aren’t present in the StorCLI files and it does not give very nicely structured data, So we will have to do a bit of string maniplulation to get good results.
If you’re only hear for ready made packages you can scroll down to the downloads, where the packages for PRTG and N-Central can be found.
Getting information from OMReport.exe
Getting information from the OpenManage suite is pretty easy – When you install OpenManage OMReport.exe is added to your path variable, meaning to get the chassis status you can simply open a command prompt on your server and type the command “omreport chassis”. This reports a visually nice table of information. A very quick and dirty script could be:
|
|
This script does not contain any troubleshooting, error handling, or even a decent way to filter on how the data is displayed. It will simply match the word “Critical” and if its found dump the entire omreport output as a single string, so lets change this up to make sure it’ll give the results like we want it.
To make sure we get cleaner results, we’re going to tell OMReport we don’t want simple data to be returned, but XML data.
For this, we’ll add some commands to the OpenReport CLI tool and tell powershell that the expected output is an XML string. To do that you can do the following:
|
|
After running the command above we can run $omreport to get a list of XML data, pretty useless in its current state, but its actual quite simple to extract usable data out of this. OpenManage OMReport creates an item for each chassis part with its “Computed Object State”, You can query $omreport.oma.Parent for all chassis items. The great thing about this is that you can get advanced metrics by querying the entire object, or just the health statistics by querying the computedobjstatus as follows;
|
|
So, after getting this list of information, we can alert on the chassis status simply by calling one of the variables above.
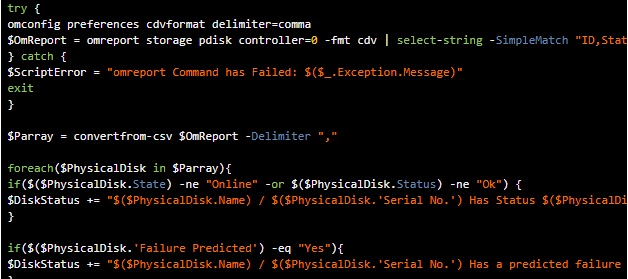
Grabbing the RAID Status via OMReport is slightly trickier. When we use the XML export funtionality we’ve used before we get alot of garbage data and non-descriptive information. To resolve this we’re using another trick out of the monitoring play: converting the data we’ve received to a CSV formatted array.
|
|
By running “omconfig preferences cdvformat delimiter=comma” we’re setting the export file to be a comma delimited file, next we set the export format to CDV which Dell believes is a CSV. ? By looping this array we get the correct results for the virtual disks. The physical disks work in exactly the same manner;
|
|
For ease of use I’ve included N-Able monitoring script for the Chassis, RAID, and physical disk monitoring
Downloads for RMM packages:
N-Central 11.0+ – Chassis Monitoring
N-Central 11.0+ – RAID Monitoring
N-Central 11.0+ – Physical Disk Monitoring
PRTG – Chassis, VD, RAID monitoring. – COMING SOON.